
Go | New | Find | Notify | Tools | Reply |
| Green grass and high tides  |
We pick the allocations. I contribute, the employer matches. Your thoughts are what I am thinking. My allocations were growth oriented too, hence the wtf? I will have to dig deeper. Surely there is some non-sence happening here. Anyone else have issues with Principal Financial? Thanks "Practice like you want to play in the game" | |||
|
| Lawyers, Guns and Money  |
Break out those Dow 26,000 hats again...  "Some things are apparent. Where government moves in, community retreats, civil society disintegrates and our ability to control our own destiny atrophies. The result is: families under siege; war in the streets; unapologetic expropriation of property; the precipitous decline of the rule of law; the rapid rise of corruption; the loss of civility and the triumph of deceit. The result is a debased, debauched culture which finds moral depravity entertaining and virtue contemptible." -- Justice Janice Rogers Brown "The United States government is the largest criminal enterprise on earth." -rduckwor | |||
|
I'm Fine |
401K is up 16% (annualized) for past year 25% annualized for past two years. 57%cumulative ------------------ SBrooks | |||
|
quarter MOA visionary |
A little bit of a correction the last couple days. | |||
|
| Lawyers, Guns and Money |
More charts and graphs at link below.... Reversion To The Mean Last week, we started into an exploration of various technical indicators with “What Exactly Is RSI.” This week, I want to continue our exploration into the signals that we most often discuss in our “Technically Speaking” posts and in our weekly Real Investment Reports. As I wrote, technical analysis is often dismissed by investors for three reasons: A lack of understanding of exactly what technical analysis is, An inability to properly apply technical analysis to portfolio management, and; The media narrative that “technical analysis” doesn’t work. There is no “one method” of technical analysis that works for everyone. Every technician uses different methods, indicators, and time-frames for their own analysis. Much depends on your personal investment time frame, risk tolerance and investing behavior. This article is the second in the series to discuss some of the more common technical indicators we use in our own portfolio management practice and how we apply them. (Note: we will be providing our specific methods of technical analysis, indicators, etc., in our forthcoming premium section of Real Investment Advice. Click here for pre-subscription information.) Today, we will continue our journey with the standard-deviation as measured with “Bollinger Bands,” and “reversions to the mean.” For Every Buyer, There Is A Seller I am often asked that since there is “always a buyer for every seller,” then how can a market become overbought? Before we get into the raw technical analysis of showing the “overbought” condition let’s rationalize what one is and how it occurs. While it is true there is a buyer and seller in every transaction, it is the “supply and demand” of those participants which determines the price. Let me explain. Sponsored By Dent Research Bitcoin: Another Nail in Gold’s Coffin All hell’s about to break loose. The run up of cryptocurrencies along with a strengthening dollar have sent Gold on a steady slide. Before you make another gold investment, it’s critical you review indisputable evidence of precisely where gold is headed next. Imagine two rooms of 100 individuals each that want to buy shares of ABC stock. Room A has 100 individuals that currently own ABC stock and Room B has 100 individuals with cash wanting to buy shares of ABC. The table below shows a very simplified model of this process. At $10 a share, there are numerous buyers but sellers are few. The demand for the shares drives the price higher which entices more sellers. As long as the demand for shares outpaces the supply of sellers – the price is pushed higher. However, at some point, the price reaches a level that exhausts the supply of buyers. The next price decline occurs as sellers have to begin lowering prices to find buyers. So, “Yes”, for every buyer there is a seller, but the question is always at “what price?” Since price is determined by the “supply/demand imbalance,” it is only logical that by using historical prices investors can determine what “price” buyers and sellers have previously been most active. Hence, the determination of both “overbought” or “oversold” conditions. The important point, from a money management standpoint, is the determination of the potential risk/reward opportunity for allocating, or extracting, investment capital at any given time. As a portfolio manager, clients tend “not to like” having their capital invested in the markets only to almost immediately suffer a principal loss. By using some measures to determine the current risk/reward outcome, the deployment of capital can be more effectively managed. Market Extensions & Reversions To The Mean Now that we have defined what overbought means – I can explain what I mean by overextended. As I discussed in “Revisiting Bob Farrell’s 10 Investing Rules”: “Like a rubber band that has been stretched too far – it must be relaxed in order to be stretched again. This is exactly the same for stock prices that are anchored to their moving averages. Trends that get overextended in one direction, or another, always return to their long-term average. Even during a strong uptrend or strong downtrend, prices often move back (revert) to a long-term moving average.” The chart below shows the S&P 500 with a 52-week simple moving average. The bottom chart shows the percentage deviation of the current price of the market from the 52-week moving average. During bullish trending markets, there are regular reversions to the mean that create buying opportunities. However, what is often not stated is that in order to take advantage of such buying opportunities profits should have been taken out of portfolios as deviations from the mean reached historical extremes. Conversely, in bearish trending markets, such reversions from extreme deviations should be used to sell stocks, raise cash and reduce portfolio risk rather than “panic sell” at market bottoms. 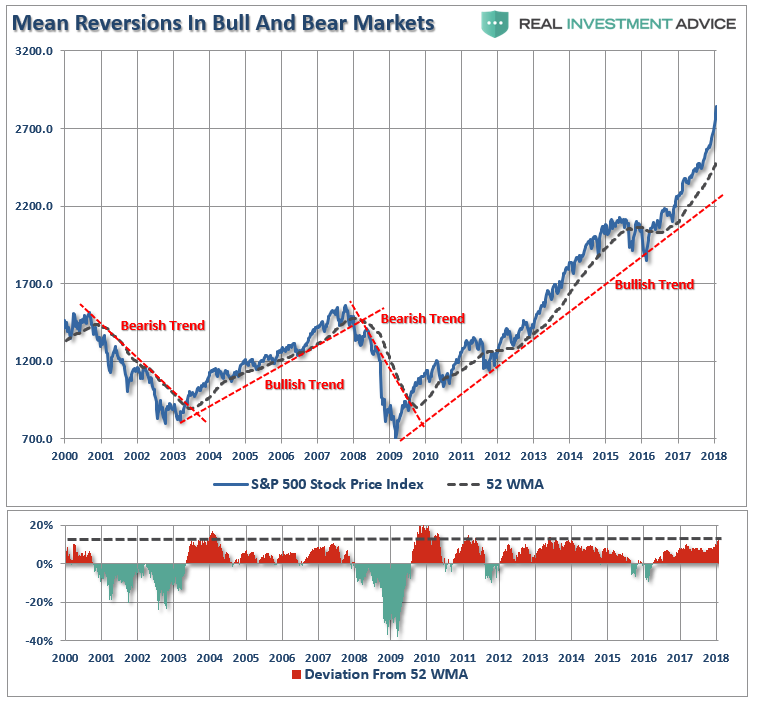 One has to ask why there is a crisis in US-Russia relations since Washington and Moscow have much more in common than… The dashed red lines denote when the market changed trends from positive to negative. Understanding, and identifying, when markets change trend is the very essence of portfolio “risk” management. The idea of “stretching the rubber band” can be measured in several ways, but I will limit our discussion this week to Standard Deviation and measuring deviation with “Bollinger Bands.” “Standard Deviation” is defined as: “A measure of the dispersion of a set of data from its mean. The more spread apart the data, the higher the deviation. Standard deviation is calculated as the square root of the variance.” In plain English this means, and as shown in the chart below, is that the further away from the average that an event occurs the more unlikely it becomes. As shown below, out of 1000 occurrences, only three will fall outside of the area of 3 standard deviations. 95.4% of the time events will occur within two standard deviations. For the stock market, and as shown in both charts above, the standard deviation is measured is with Bollinger Bands. John Bollinger, a famous technical trader, applied the theory of standard deviation to the financial markets. Because standard deviation is a measure of volatility, Bollinger created a set of bands that would adjust themselves to the current market conditions. When the markets become more volatile, the bands widen (move further away from the average), and during less volatile periods, the bands contract (move closer to the average). The math is pretty straight-forward as shown in the table below. (The only difference between 2, 3 or 4 standard deviations from the mean is the multiplication factor at the end of the formula) This can be calculated in Excel by using the STDEVPA formula as follows: =Current 52-Week MA level +/- (STDEVPA(52-week range of S&P 500 prices) * 2, 3 or 4) The following chart illustrates the output. The dashed purple line is the 52-week (1-year) moving average (or mean) with the shaded area representing 2-standard deviations. As shown in the chart above, 2-standard deviations encompass 95.4% of all probable price movement. Even during the 2012-15, QE3 driven, stock advance, there were several corrections back to the 52-week moving average, or further, which allowed for increases in equity risk within the ongoing bull market advance. However, currently, the market is pushing towards 4-standard deviations (99.9 percentile) above the 52-week mean. As shown below, this is “rarefied air” for the market historically. The next chart shows this more clearly. Currently, the deviation above the 52-week moving average is at levels not seen previously going back to 1981. Previously, large deviations from a long-term mean have coincided with mild to severe market corrections and crashes. Given the current extreme deviation, one can only assume a negative outcome in the future. Over the next several weeks, or even months, the markets can certainly extend the current deviations from long-term mean even further. But that is the nature of every bull market peak, and bubble, throughout history as the seeming impervious advance lures the last of the stock market “holdouts” back into the markets. As Vitaliy Katsenelson once wrote: “Our goal is to win a war, and to do that we may need to lose a few battles in the interim. Yes, we want to make money, but it is even more important not to lose it.” I wholeheartedly agree with that statement which is why we remain invested, but hedged, within our portfolios currently. Unfortunately, for most investors, they have very little understanding of the dynamics of markets and how prices are “ultimately bound by the laws of physics.” While prices can certainly seem to defy the law of gravity in the short-term, the subsequent reversion from extremes has repeatedly led to catastrophic losses for investors who disregard the risk. With sentiment currently at very high levels, combined with low volatility and excess margin debt, all the ingredients necessary for a sharp market reversion are currently present. As I noted last week, technical analysis IS NOT some “black box” approach to portfolio management. However, what technical analysis does provide is a method to extract “emotion” from the “buy/sell” process. For us, the fundamentals dictate WHAT we “buy” and “sell” in portfolios, but it is the technicals that drive the WHEN those decisions are implemented. Remaining fully invested in the financial markets without a thorough understanding of your “risk exposure” will likely not have the desired end result you have been promised. Just remember, in the market there really isn’t such a thing as “bulls” or “bears.” There are only those that “succeed” in reaching their investing goals and those that “fail.” https://www.zerohedge.com/news...01-31/reversion-mean "Some things are apparent. Where government moves in, community retreats, civil society disintegrates and our ability to control our own destiny atrophies. The result is: families under siege; war in the streets; unapologetic expropriation of property; the precipitous decline of the rule of law; the rapid rise of corruption; the loss of civility and the triumph of deceit. The result is a debased, debauched culture which finds moral depravity entertaining and virtue contemptible." -- Justice Janice Rogers Brown "The United States government is the largest criminal enterprise on earth." -rduckwor | |||
|
| I'm Fine |
the only problem is you don't ever know when those bullish/bearish/up/down trends have started or stopped until days or weeks after the fact. Hence the problem with timing the market ------------------ SBrooks | |||
|
Now in Florida |
There is a saying among traders that you have to trade from the hard right edge of the chart....meaning you don't know what is coming next. You look at a chart and everything looks so obviously clear...when trends start, when they end, etc. But that is all in hindsight. Your profit or loss doesn't depend on what is already in the chart - it depends on what happens past the edge of the chart, the part that hasn't been made yet. At the hard right edge of the chart, there is no way to know how the chart will continue to unfold. | |||
|
| Green grass and high tides |
So here is a question. If your portfolio is pretty balanced with a mix of stock funds say at 60% and a mix of bond funds at around 40%. You have realized a reasonable rate of growth during this run up period based on those choices. You are planning to retire in less than 5 years. You are thinking the market is going to flatten out some and maybe correct itself some in the next year but not a big correction. All speculative mind you. Not trying to time the market. Are a conservative minded investor. What would you do? Leave it as is or adjust? "Practice like you want to play in the game" | |||
|
| Lawyers, Guns and Money |
In that case you should stick with your 60%/40% mix for the long term. The problem with jumping out and back in is that you have to live at the "hard right edge of the chart" and you have to be right twice. That's why timing is so hard. "Some things are apparent. Where government moves in, community retreats, civil society disintegrates and our ability to control our own destiny atrophies. The result is: families under siege; war in the streets; unapologetic expropriation of property; the precipitous decline of the rule of law; the rapid rise of corruption; the loss of civility and the triumph of deceit. The result is a debased, debauched culture which finds moral depravity entertaining and virtue contemptible." -- Justice Janice Rogers Brown "The United States government is the largest criminal enterprise on earth." -rduckwor | |||
|
| I believe in the principle of Due Process  |
You don’t lose money when the stocks you own decline in price. You may lose if when you decide, or need, to sell, the price is less than you paid at purchase. I’ve been through the technical analysis theories as thoroughly as possible, investigated nearly all of them, been to the seminars, read the books, run the programs, even wrote a few many years ago. I have never found a reliable indicator or combination of indicators or trading rules based on price action. Sometimes they turn out to be right, sometimes they turn out to be wrong. This is in the realm of coincidence. These activities are not investing, but mere speculation. It is apparently true that some have made money following these schemes, besides the writers and sellers of book, dvds, seminars, software and data. I know that if I were to uncover a reliable method of price forcasting, I sure as hell would not write a book, or spend the rest of my life, or any portion thereof, doing weekend seminars, eating hotel food, enduring idiotic questions from newbies, even if adoring. My investment results improved markedly when I gave up all that foolishness and once more “danced with the one that brung me,” Graham and Dodd. Value investing starts with the first point, buy low...... don’t pay too much! Determining “intrinsic value” is the key. There are various ways to arrive at intrinsic value, financial statement analysis, comparative analysis, even like Phil Fisher prized, “scuttlebutt.” Once you come up with that estimate of value, you start looking at current pricing. It doesn’t matter whether it has been going up, or going down, or whether the moon phases line up, or the 50 day moving average is crossing the 200 day moving average or any of that. Is there a margin for error in the price compared to your estimate of value? If not, keep looking. If so, maybe you can buy some shares. Not otherwise. Another idea is to deal in what you understand. This will save you from all sorts of foolishness, like Enron, and technical marvels which too often sell for hopelessly optimistic prices anyway and nearly as often end in disaster. Don’t pay too much attention to the daily prices. Pay attention to how your business is doing. Are the sales and income doing well? Management honest and efficient? Financing conservative, debt if not low at least not high? Employee relations positive? Industry trends? As long as these factors are positive, why sell? This is actually the most difficult problem in my view. I don’t really have a firm rule or policy or suggestion here. I suppose it could happen that the price of your shares could get to a level completely out of touch with business realities, but how to tell? Look up Ben Graham’s allegory, “Mr. Market” from his book, The Intelligent Investor. That is the best description I know of, of what investors should try to do. If it was easy, everybody would do it! Luckily, I have enough willpower to control the driving ambition that rages within me. When you had the votes, we did things your way. Now, we have the votes and you will be doing things our way. This lesson in political reality from Lyndon B. Johnson "Some things are apparent. Where government moves in, community retreats, civil society disintegrates and our ability to control our own destiny atrophies. The result is: families under siege; war in the streets; unapologetic expropriation of property; the precipitous decline of the rule of law; the rapid rise of corruption; the loss of civility and the triumph of deceit. The result is a debased, debauched culture which finds moral depravity entertaining and virtue contemptible." - Justice Janice Rogers Brown | |||
|
| Just because you can, doesn't mean you should |
You would need a good benchmark to compare your investment performance to anything else. Don't just look at a year of two but 5, 10 and 20 years. A good place to start would be a low fee index fund that invests in the S&P 500, NASDAQ or other mainstream fund. Very few managed funds outperform them over time, especially when you factor in the various charges. ___________________________ Avoid buying ChiCom/CCP products whenever possible. | |||
|
| Lawyers, Guns and Money |
 "Some things are apparent. Where government moves in, community retreats, civil society disintegrates and our ability to control our own destiny atrophies. The result is: families under siege; war in the streets; unapologetic expropriation of property; the precipitous decline of the rule of law; the rapid rise of corruption; the loss of civility and the triumph of deceit. The result is a debased, debauched culture which finds moral depravity entertaining and virtue contemptible." -- Justice Janice Rogers Brown "The United States government is the largest criminal enterprise on earth." -rduckwor | |||
|
eh-TEE-oh-clez |
Is there a good rule of thumb amount of cash to keep in the savings/checking account instead of in investments? | |||
|
| Lawyers, Guns and Money |
Probably enough to pay your bills for 3 months... many say 6 months. But it depends on your income/cash flow relative to expenses. "Some things are apparent. Where government moves in, community retreats, civil society disintegrates and our ability to control our own destiny atrophies. The result is: families under siege; war in the streets; unapologetic expropriation of property; the precipitous decline of the rule of law; the rapid rise of corruption; the loss of civility and the triumph of deceit. The result is a debased, debauched culture which finds moral depravity entertaining and virtue contemptible." -- Justice Janice Rogers Brown "The United States government is the largest criminal enterprise on earth." -rduckwor | |||
|
| Member |
depends on the nature of your employment also for instance if you have a commission heavy, boom / bust career... might want 6-9+ months in cash to weather the lean times super stable government-type job - 6 months is probably enough to sleep well at night also - are you married? - if you have a working spouse with a stable income that would be a factor also personally - I am restful with 7-9 month reserve in a mixture of MM funds and saving accounts question -- how long do you think it would take to find a similar position if your's ended? -------------------------------------- Proverbs 27:17 - As iron sharpens iron, so one man sharpens another. | |||
|
| Member |
Oh, I am having a very bad day.....Dow down 4.6% in a day. I was pretty smug. ---------------------------------------------------- Dances with Crabgrass | |||
|
Tinker Sailor Soldier Pie |
Dang. What the heck just happened? ~Alan Acta Non Verba NRA Life Member (Patron) God, Family, Guns, Country Men will fight and die to protect women... because women protect everything else. ~Andrew Klavan | |||
|
Alienator |
Blaze markets tanked due to speculation that the interest rates will climb faster than expected. SIG556 Classic P220 Carry SAS Gen 2 SAO SP2022 9mm German Triple Serial P938 SAS P365 FDE P322 FDE Psalm 118:24 "This is the day which the Lord hath made; we will rejoice and be glad in it" | |||
|
Member |
It varies by individual but I don't keep much in checking account. With Vanguard I can move money from my brokerage account to my checking account or vice versa if I want to. At least I can make 1.45% in Vanguard Prime MM versus next to nothing in my checking account. MM funds have no FDIC protection like in banks if that is a concern though. | |||
|
| eh-TEE-oh-clez |
1.45% in a non-FDIC insured money market account seems a little off? American Express and a number of other banks offer 1.45% as an FDIC insured High-Yield Savings account... | |||
|
| Powered by Social Strata | Page 1 ... 4 5 6 7 8 9 10 12 |
| Please Wait. Your request is being processed... |
© SIGforum 2026